
 Application report · Short versionTest bench automation · Q.station · test.con.novaAs of 19 November 2026
Automated development and virtual commissioning
A test bench takes shape in the computer
Three pages of specification became a fully tested control program for a temperature-dependent dosing test bench in 9 h 48 min of working time – without a single device on the table.
- 9.8 h
- from the specification to the user documentation
- 29
- requirements in the specification, each covered by a test case
- 1,955
- blocks in the program, created by a generator
- 35
- automated checks, all 17 fault codes triggered
- 8
- program errors found before there is a plant
- 0 h
- on real hardware
The taskHow accurately does a pump dose when it gets cold or warm?
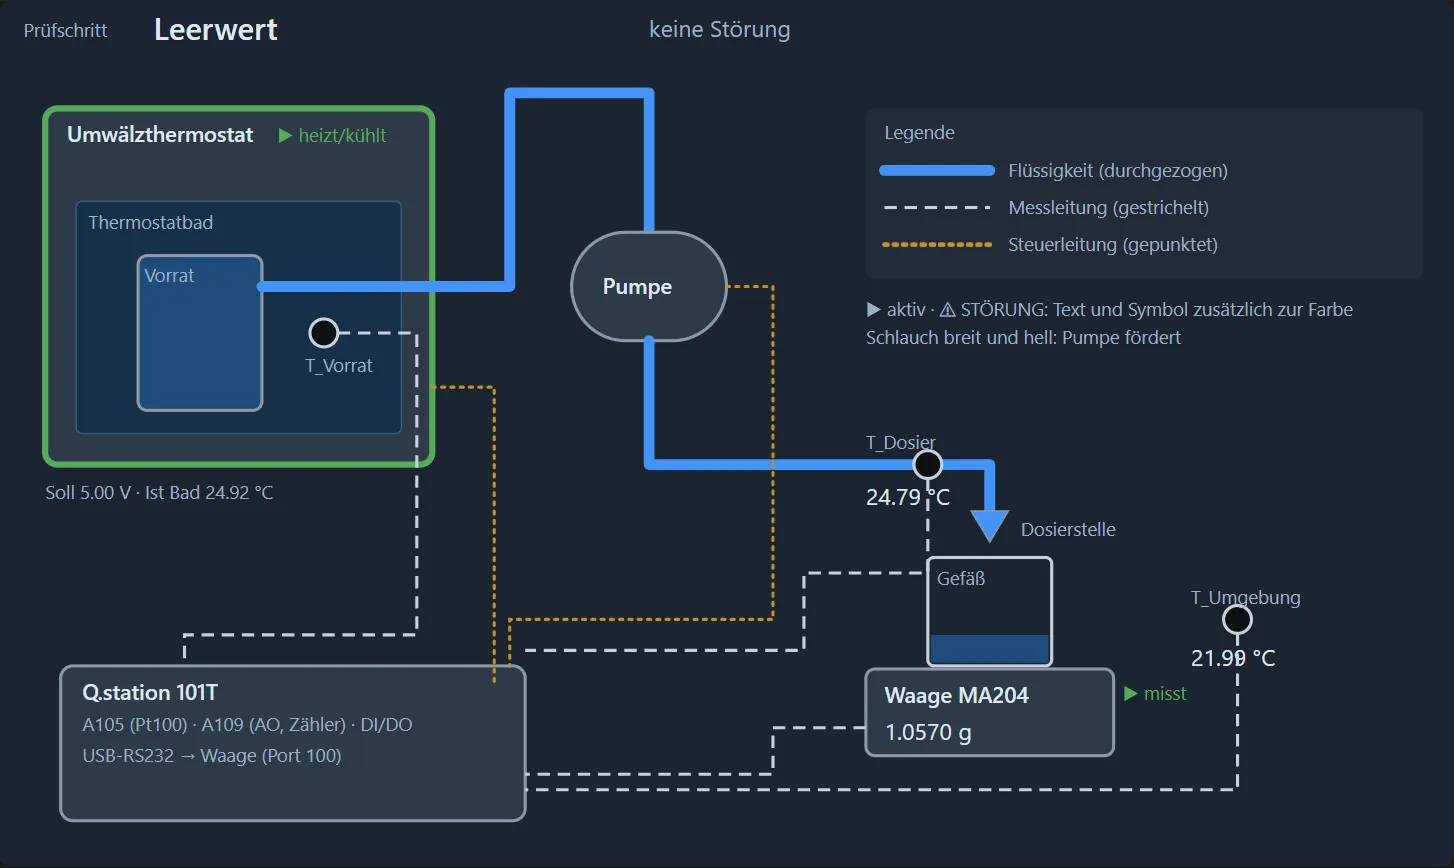
The test bench measures how far the dosing volume of a peristaltic pump at 15 and 35 °C deviates from its setting at 25 °C. The pump delivers water from a temperature-controlled reservoir into a vessel on an analytical balance; the volume follows from the mass and the density at the measured temperature. The project was also set up as a reference: how far can the development of such a system solution be automated, and how much of the commissioning can be done in advance on the computer?
The approachFour steps, each building on the result of the previous one
- Specification and system solution29 requirements evaluated, 12 gaps and 5 inconsistencies found. The questions came as a choice with a recommendation and were decided in five minutes.
- Hardware and configurationChannel balance, parts list and architecture diagram by script. The Q.station configuration passed the rule check in GI.bench without a connected device.
- Program by generator7 requirements with 56 acceptance criteria, architecture, 23 test cases. A generator creates the test.con.nova project including the dashboard. Up to here: 1 h 25 min.
- Virtual commissioning and testA test driver plays the plant and the balance, injects faults and checks the reaction; 9 complete regression runs. 6 h 05 min.
Application report 007 “Temperature-dependent dosing test bench”, short version.Page 1 of 4
The division of labourThe engineer decides, the AI does the work
The AI assistant Claude Code wrote the analysis, documents, program, simulations, tests and reports. It operated the development environment test.con.nova, the successor of test.con, through its MCP interface; the target device was the Simulator Q, which runs the runtime kernel of a Q.station on the PC. Steffen Mertens set the direction, decided and accepted: 21 instructions and confirmations in two days. He did not draw a single block or write a single test case, but he decided wherever there was something to decide.
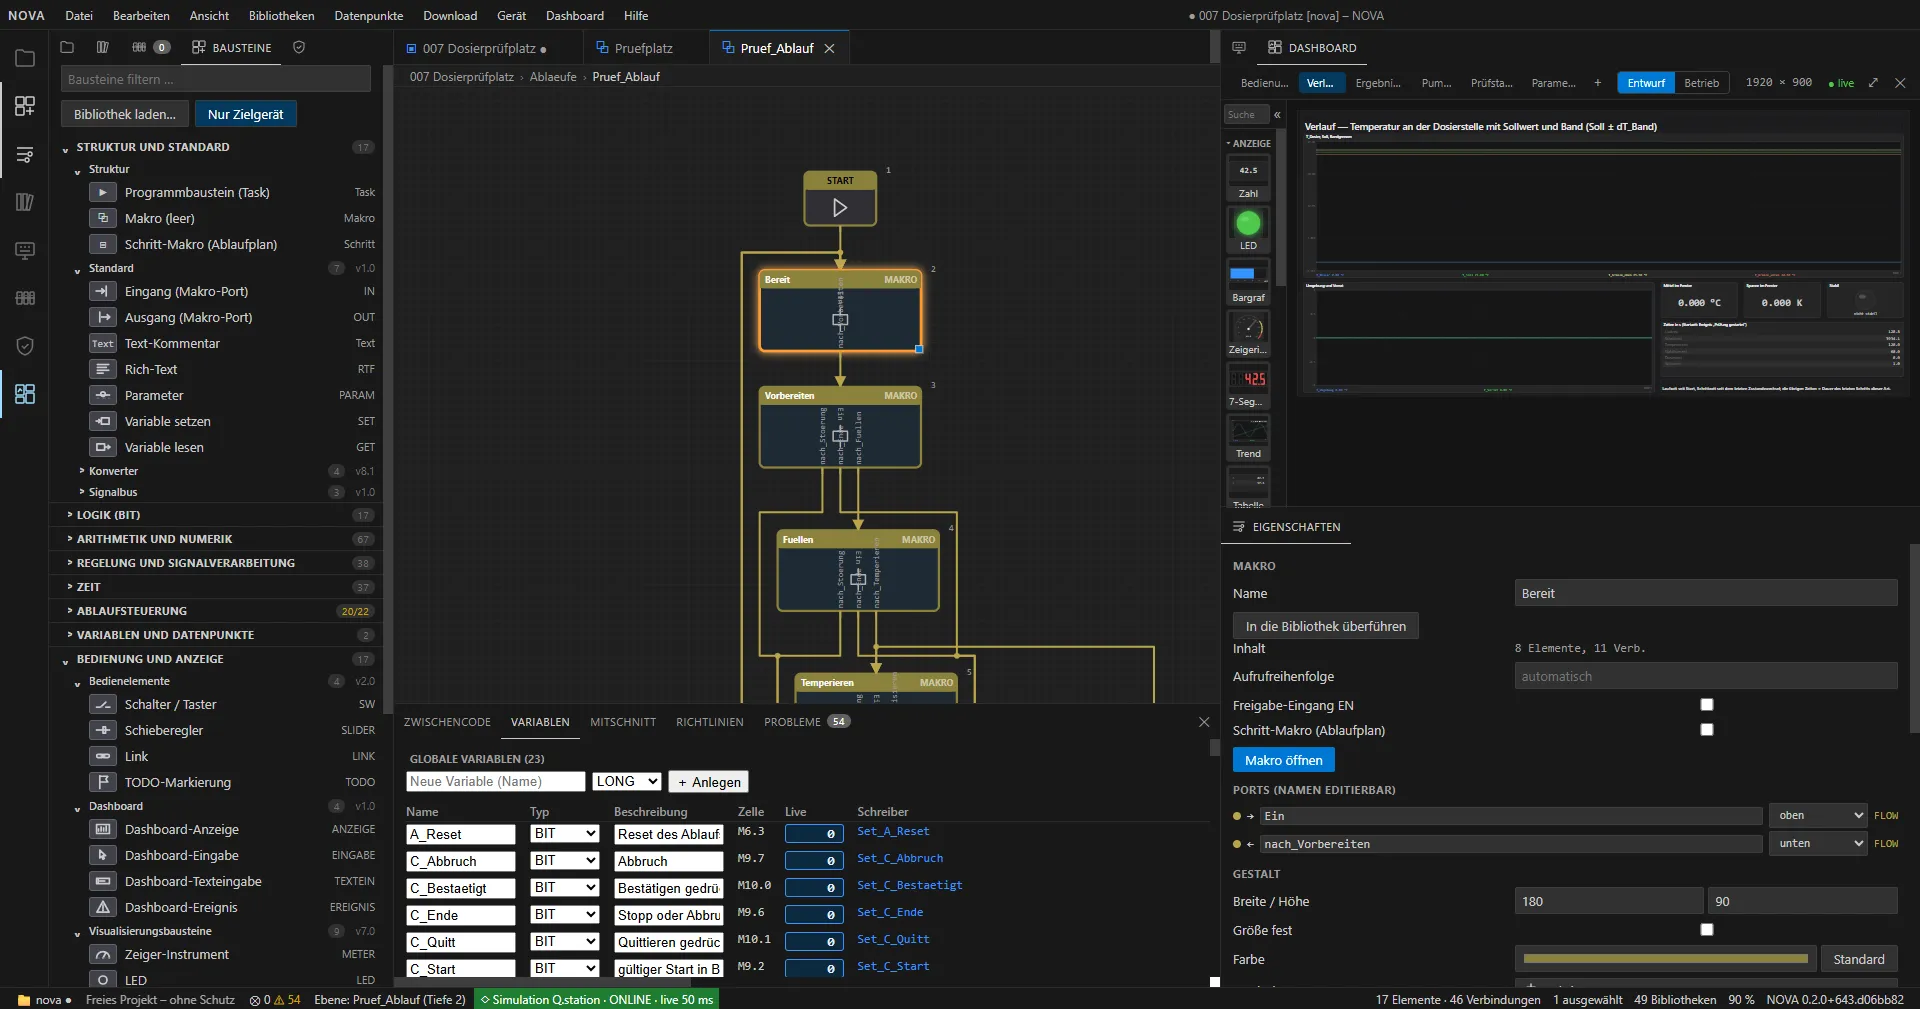
The toolProgram and user interface are created in test.con.nova
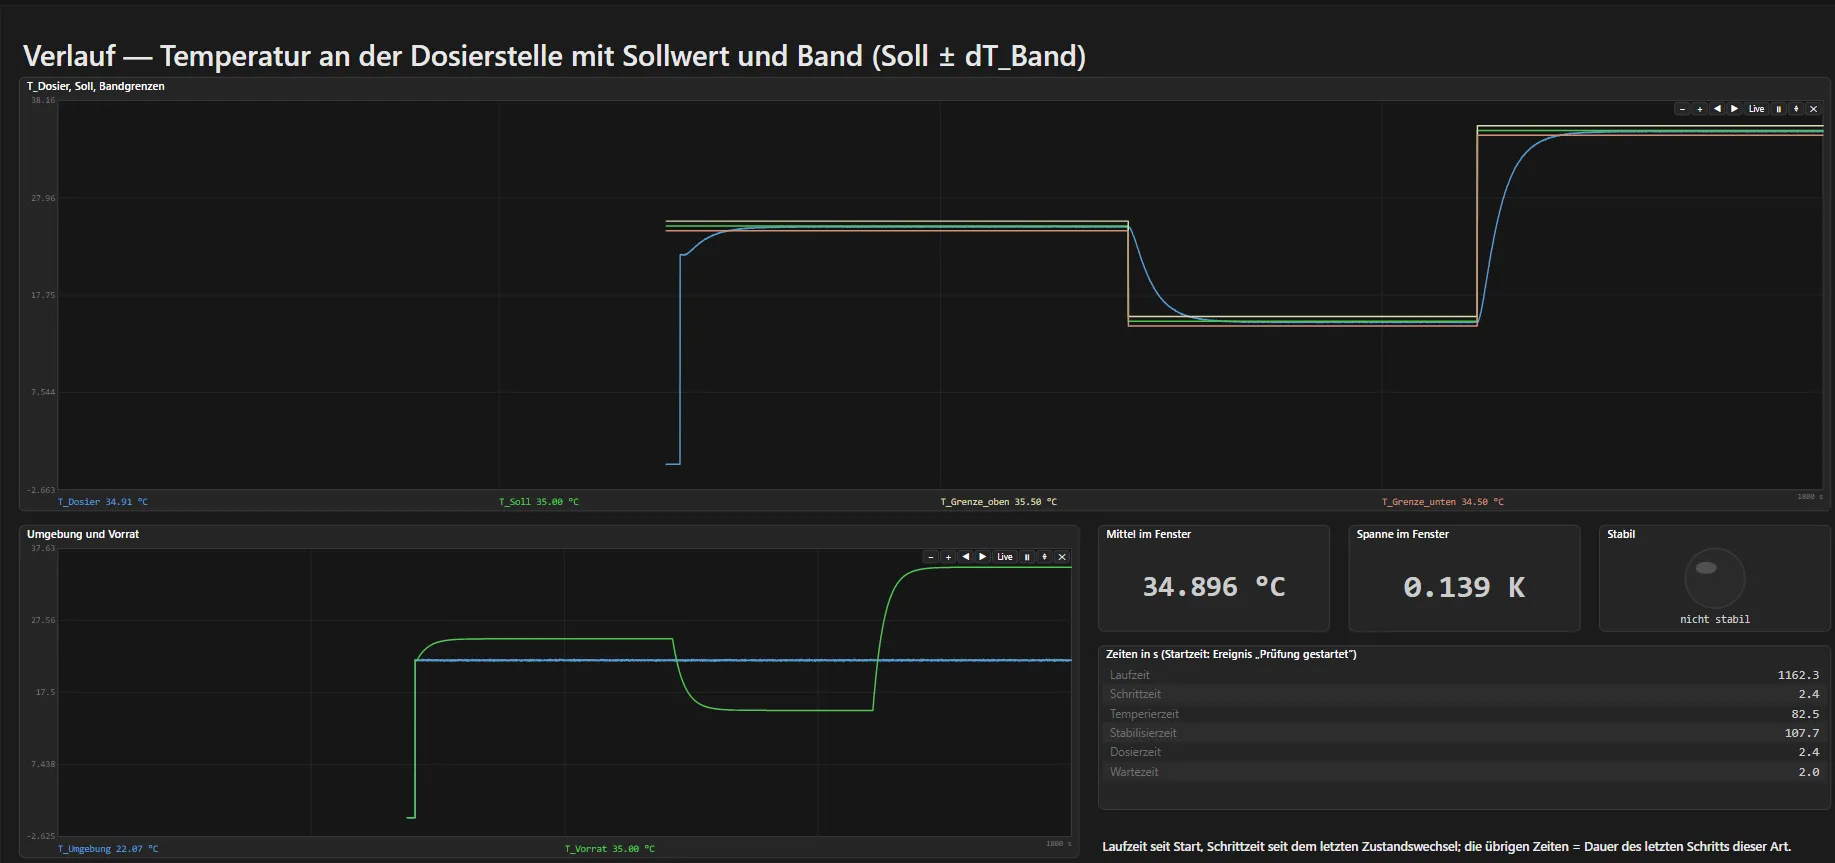
test.con.nova is the development environment for applications on the Q.station: block diagrams with tasks and macros, sequences as state machines, the configuration of the station and the dashboard for operation all live in one project.
Application report 007 “Temperature-dependent dosing test bench”, short version.Page 2 of 4
The Q.stationFrom the specification to the inputs and outputs
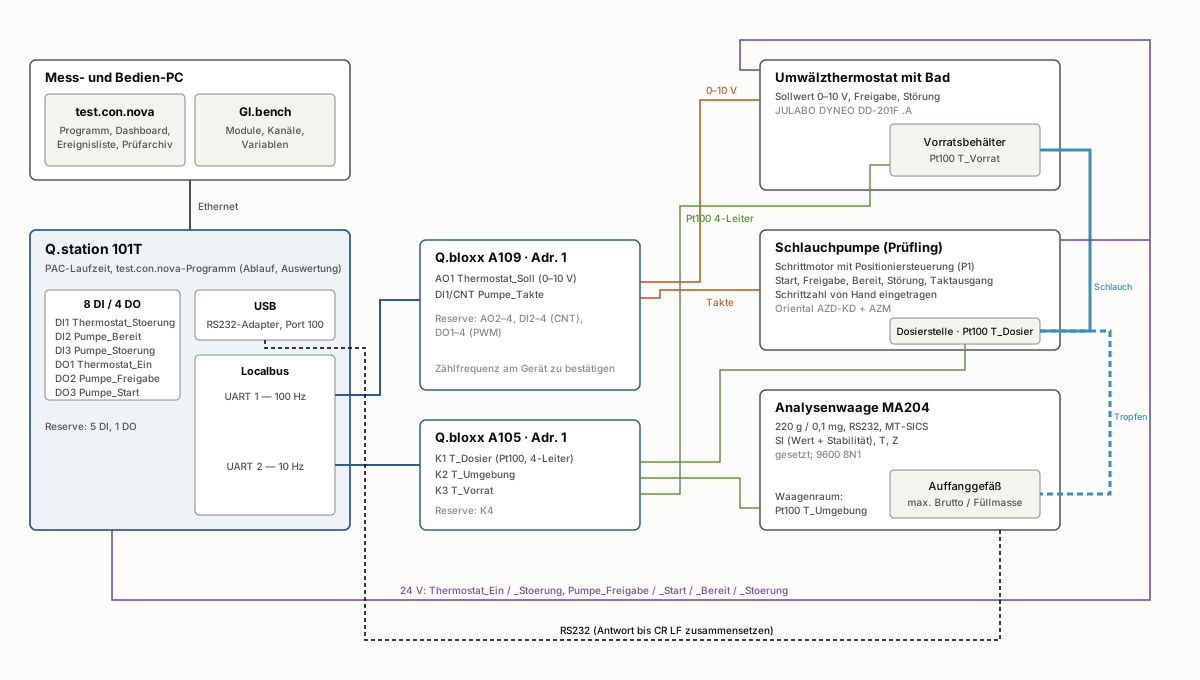
No channel is set by hand, each one is derived: a function in the specification becomes a signal, the signals become a channel balance, the balance becomes the module selection and that becomes the configuration of the station.
- From function to signal. The system solution defines for each device how it is connected. The thermostat controls itself: it receives a setpoint (0–10 V) and an enable and reports faults. The pump controller positions itself: enable, start, ready and fault are digital, its pulse output goes to a counter so that the station can cross-check the manually set step count. The required stability of ±0.5 K calls for Pt100 in 4-wire technology. The balance communicates serially (MT-SICS).
- From signal to module selection. The channel balance counts the demand per signal type and gives each at least one spare channel; the channels of the modules come from the module catalogue of test.con.nova. Of three variants calculated by script, the smallest one covering everything with spare capacity was chosen: Q.station 101T with Q.bloxx A105 and A109.
- Two design rules. Digital signals sit on the controller so that the counter inputs of the A109 remain free as spares. Fast and slow channels run on separate local bus lines: A109 at 100 Hz, A105 at 10 Hz.
| Input | Purpose | Channel |
|---|---|---|
| T_Dosier | Stability before each series, density | A105 K1, Pt100 |
| T_Umgebung | Temperature in the balance room | A105 K2, Pt100 |
| T_Vorrat | Reservoir in the bath | A105 K3, Pt100 |
| Pumpe_Takte | Cross-check of the step count | A109 DI1, counter |
| Thermostat_Stoerung | Fault signal of the thermostat | Q.station DI1 |
| Pumpe_Bereit | Controller ready to start | Q.station DI2 |
| Pumpe_Stoerung | Fault of the pump controller | Q.station DI3 |
| Output, interface | Purpose | Channel |
|---|---|---|
| Thermostat_Soll | Setpoint of the bath temperature | A109 AO1, 0–10 V |
| Thermostat_Ein | Enable of the thermostat | Q.station DO1 |
| Pumpe_Freigabe | Enable of the pump controller | Q.station DO2 |
| Pumpe_Start | Start of a dose (pulse) | Q.station DO3 |
| Waage | Mass, tare, zero | USB-RS232, port 100 |
| Spare | 17 free channels, at least one per signal type | |
The configurationThe station is set up before it exists
- The plan is the source. A script creates the configuration plan from the signal assignment (two modules, 11 variables); test.con.nova takes it over in one call. Changes are made in the script, not by hand in the editor.
- Checked with the manufacturer’s tool. The rule check in GI.bench ran without a device. Only its hints showed that the Pt100 had been set up as 2-wire. After the correction: 0 errors, 0 warnings, 5 explainable hints.
- Transferred as to a real device. A guided dialogue compares plan and device, transfers and checks afterwards. The simulator then holds 56 variables of the hardware and the program.
- The balance is not in the plan. It is connected to the station via USB-RS232 and addressed in the program through the serial library; the configuration plan does not yet know serial devices.
- To be confirmed on the device: characteristic of the thermostat setpoint, polarity of the fault signals, counting frequency of the A109.
Application report 007 “Temperature-dependent dosing test bench”, short version.Page 3 of 4
The key pointThe bottleneck is no longer drawing, but proof
It took 1 h 25 min until the program was drawn – including specification, system solution, hardware, configuration, requirements, architecture and test specification. Proving that it works correctly took about four times as long: 6 h 05 min or 62 % of the total time. Of this, the simulator ran on its own for 4 h 29 min, without anyone having to watch.
- 59 min · Analysis, concept, documents
- 35 min · Program by generator
- 47 min · Dashboard
- 48 min · Drawing quality
- 12 min · Cybersecurity questions
- 22 min · User documentation, screenshots
- 4 h 29 min · Test: automated runs on the simulator
- 1 h 36 min · Test: work on the test
The yieldWhat virtual commissioning found
- Eight program errors, all before the plant. Most of them sat at cycle boundaries, where a simple trial run shows nothing: after an abort the log said “completed normally”, and a pump fault could be acknowledged although its cause was still present.
- Running through does not mean correct. The first complete test ran through without errors straight away, but the standard deviation was exactly zero. Only the comparison with an independent reference calculation showed this; the cause lay in the tool.
- The test bench in the computer is a device under test too. Eleven further errors lay in the test setup. The simulated balance, for example, tared immediately, a real one only once the reading is stable.
- The long sequence in 20 minutes. A complete test with operating parameters, 65 doses over three temperatures with a vessel change, ran through without a fault. The delivered volume fell by 1.85 % at 15 °C and rose by 1.56 % at 35 °C, exactly as built into the pump simulation. So the program measures and calculates correctly; it says nothing about the real pump.
The limitWhat has been shown – and what remains for the plant
Shown virtually
- Configuration of the Q.station including the GI.bench rule check
- complete test sequence with calibration and vessel change
- MT-SICS balance dialogue with piecewise responses and all balance faults
- all 17 fault codes, acknowledge, stop, abort, reload during dosing
Only testable on real hardware
- counting frequency of the A109 against the drive’s pulse, level converters, coupling relays
- actual dynamics of thermostat and bath
- thermal influences, evaporation and drift at the balance
- run time and memory on a real Q.station 101T
For further projectsThree lessons
- Generate instead of draw. A generator makes every correction reproducible and checks rules the editor silently passes over.
- Check against references, not against expectations. A sequence that runs through is not yet a correct sequence.
- Put people in the right places. The assistant cannot take over deciding, approving and looking: the visual inspection of the dashboard found an error that 35 automated checks had missed.
Along the way the tool has improved: at least six findings went to the development of test.con.nova. The next step is the real plant. There it will become clear how much of the commissioning is already done.
All figures come from the project documents, the log and the measurement data of the test runs.Page 4 of 4