Chart
This function block controls a chart in an HMI that displays curves defined in the connected matrix.
The matrix with the values is connected to the input MX. Every row in the matrix represents one curve. The chart can display up to six curves. So only the first six rows are read and more rows will be ignored.
The number of sampling points for every curve does not depend on the size of the matrix. The user can decide if the display of the curves depends on the scaling of the X-axes or is completely independent. If the input iScaleX is NOT connected, the number of drawn curve segments will be calculated by the difference of the maximum and minimum X value. If the input iScaleX is connected, its value defines the number of curve segments. This means there will be iScaleX+1 points used and interconnected to form the curve.
The input iOff is used to set the offset, which defines the index of the starting point within a row to read the values. If more points are needed than values remain in the row, the object starts reading again at the beginning of the row. If the offset is larger than the number of elements in a row, this offset is ignored and the values are read from the beginning.
The minimum and maximum values of both axes can be set by the inputs lMinX and lMaxX or lMinY and lMaxY.
The input bShow is used to show or hide the HMI object. The input bEnab is used to set the chart active or inactive (grayed out). The update of the display is controlled with bTrig. When the input changes from LOW to HIGH the chart will be updated.
HMI object
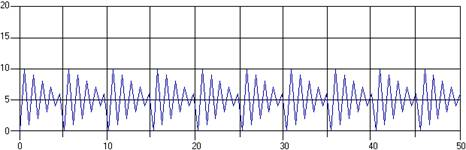
The HMI object displays the course of up to 6 signals. If the chart has to display more values than the number of points possible to draw, for every sample point the maximum and minimum value is saved. In the case of many values and a short chart object for every signal actually two lines will be drawn, which will describe the envelope of the original input values.
Parameter
The mask designer is called as the parameter dialog via the context menu of the block. An HMI object of the type "Chart" is assigned to the block by creating or selecting it. With the checkbox in the lower left corner you can switch between global and instanceable assignment.
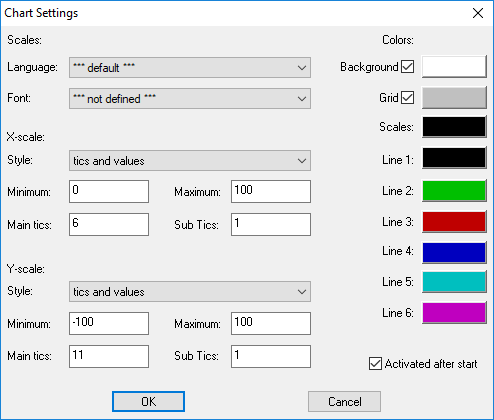
Default settings for the HMI object are made in the corresponding dialog, which appears after "Additional settings …". The font, the display style, the minimum and maximum value as well as the number of tics are defined for both scales here. Additionally, the colors of the different elements of the object are selected. Background and grid can be deactivated. Then the chart is transparent.
If a font with anti-aliasing is used, in addition to the foreground color, several gradations up to the background color are used to smooth out edges during text output. If the resulting glimmering of the background color interferes when the object is transparent, it is recommended to change the background color or to choose a font without anti-aliasing.
Signals
| Name | I/O | Type(s) | Function |
|---|---|---|---|
| MX | I | FLOAT, DOUBLE, UCHAR, WORD, LONG, LONGLONG | Matrix with the values |
| iOff | I | WORD | Offset |
| iScaleX | I | WORD | Number of line segments to be drawn |
| lMinX | I | LONG | Minimum of the X scale |
| lMaxX | I | LONG | Maximum of the X scale |
| lMaxY | I | LONG | Maximum of the Y scale |
| lMinY | I | LONG | Minimum of the Y scale |
| bShow | I | BIT | Show/hide chart |
| bEnab | I | BIT | Enable/disable chart |
| bTrig | I | BIT | Update chart (change LOW-> HIGH) |
Note: If inputs are not connected the object appears with the corresponding default parameters that have been entered in the mask designer. Otherwise the input signal from the function block overwrites the according setting from the parameter dialog.
Visualization
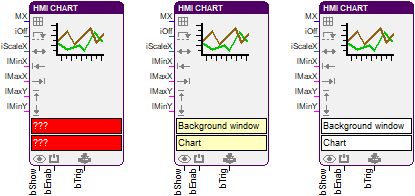
The assignment of the HMI object is displayed in the block by the color of the text boxes. A yellowish background indicates a global assignment. If the assignment is instanceable, the background is white. And at missing or incorrect assignment it is red.
Comment
The data type of the input MX is defined by the connected matrix.
The input lMinX and lMaxX have to be connected both or not at all.
The input lMinY and lMaxY have to be connected both or not at all.
Example
Given is a 1x10 matrix with the values {(0,10,1,9,2,8,3,7,4,6)}. The offset is set to 0, so the chart line will be start drawing with the first element of the matrix.
Is iXScale is set to 4, then the line will consist of four segments, which means the first five points are used as sample points for the line.
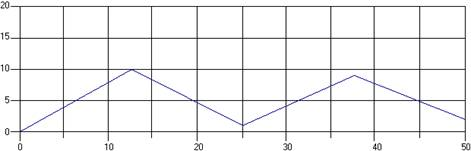
Is iXScale is set to 99, then the line will consist of 99 segments, which means 100 points are used as sample points for the line and so the ten existing points are used again and again.